Libraries
Matplotlib的基本使用
字体和Unicode使用
import matplotlib.pyplot as plt
import matplotlib
import numpy as np
import matplotlib.ticker as mtick

plt.rcParams["axes.labelsize"] = 16
plt.rcParams["xtick.labelsize"] = 15
plt.rcParams["ytick.labelsize"] = 15
plt.rcParams["axes.titlesize"] = 15
plt.rcParams['legend.fontsize'] = 15

plt.rcParams['font.family'] = 'serif'
plt.rcParams['font.serif'] = ['Times New Roman'] + plt.rcParams['font.serif']

fig = plt.figure(figsize=(7,5))
ax = fig.add_subplot(111)

T = np.linspace(273.15, 1000.0, 100)
y1 = 1.0 * np.exp(-210000/8.31451/T)
y2 = 1.0 * np.exp(-220000/8.31451/T)
y3 = 1.0 * np.exp(-230000/8.31451/T)

line1, = ax.plot(T, y1, label="Diffusion coefficient - 1", color="#278740", marker="d", linestyle="-", linewidth=2, markevery=4)
line2, = ax.plot(T, y2, label="Diffusion coefficient - 2", color="#B330EE", marker="s", linestyle="-", linewidth=2, markevery=4)
line3, = ax.plot(T, y3, label="Diffusion coefficient - 3", color="#00635D", marker="o", linestyle="-", linewidth=2, markevery=4)

ax.set_xlabel("Temperature, K")
#  for subscripts and superscript: https://blog.csdn.net/ToraNe/article/details/102883856
ax.set_ylabel("Diffusion coefficient, m\u00b2 /s")

ax.yaxis.set_major_formatter(mtick.ScalarFormatter(useMathText=True))

ax.set_xlim([273.15, 1000.0])

plt.legend()

plt.tight_layout()

plt.savefig("figure.png", dpi=300)
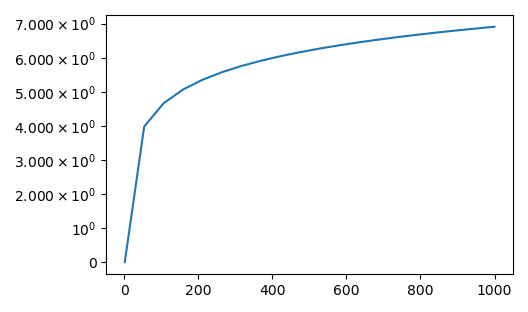
自定义的坐标轴刻度标签
import matplotlib.pyplot as plt
from matplotlib.ticker import ScalarFormatter
import numpy as np
import matplotlib.ticker as ticker

def customFormatter(value, _):
    if abs(value) > 1.0e-10:
        if value < 0:
            sign = '-'
            value *= -1
        else:
            sign = ''
        exponent = int(np.floor(np.log10(value)))
        multiplier = value / (10 ** exponent)
        if multiplier % 1 < 0.0000001:
            multiplier = int(multiplier)
        if multiplier == 1:
            label = str((r'$%s%s^{%d}$') % (sign, 10, exponent))
        else:
            label = str((r'$%s%.3f\times%s^{%d}$') % (sign, multiplier, 10, exponent))
    else:
        label = str('{0:g}'.format(value))
    return label

x = np.linspace(1.0, 1000.0, 20)
y = np.log(x)

fig, ax = plt.subplots()
ax.plot(x, y)
ax.yaxis.set_major_formatter(ticker.FuncFormatter(customFormatter))

plt.tight_layout()

plt.show()
仅生成colorbar
import matplotlib.pyplot as plt
import matplotlib as mpl

def make_colorbar(vmin, vmax, dest):

    # fig, ax = plt.subplots(figsize=(1.0, 1.0))
    fig = plt.figure(figsize=(0.8, 1.2))
    # ax = fig.add_subplot(111)

    norm = plt.Normalize(vmin, vmax)
    # 创建一个用于colorbar的线性归一化对象
    norm = mpl.colors.Normalize(vmin=vmin, vmax=vmax)

    # 创建colorbar
    cbar = fig.colorbar(mpl.cm.ScalarMappable(norm=norm, cmap='viridis'),
                        cax=plt.axes([0.1, 0.1, 0.2, 0.8]),
                        orientation='vertical')

    plt.savefig(dest, dpi=300, bbox_inches="tight")
    plt.clf()
    plt.close()
    # plt.show()

if __name__ == "__main__":
    make_colorbar(0, 1, "fields/colorbar.svg")
    make_colorbar(0, 0.3, "fields/colorbar-composition.svg")
放大图中的局部内容
import matplotlib.pyplot as plt

fig = plt.figure(figsize=(3, 2))
ax = fig.add_subplot(111)

axins = ax.inset_axes([0.5, 0.10, 0.4, 0.4], xticklabels=[], yticklabels=[])

ax.plot([1, 2, 3, 4, 5, 6, 7, 8], [1, 2, 3, 4, 5, 6, 7, 8], label="main")

axins.plot([1, 2, 3], [1, 2, 3], label="inset")

ax.indicate_inset_zoom(axins, edgecolor="black")

ax.set_xlabel("Time, s")
ax.set_ylabel("Fraction")
plt.tight_layout()
plt.show()